

Workplace intelligence: what unreliable occupancy data really costs
It is Wednesday afternoon. A workplace director walks the third floor of their building and counts empty desks. The occupancy report on their laptop says that the floor is running at 85%.
Both numbers are real. Only one of them is going into the lease renewal.
This is not hypothetical. CBRE ran a 3 month study comparing badge data against sensor data in the same building. The badges reported 85% daily utilization. The sensors measured 59% at peak. The company was holding 8 floors when the data said it needed 6, and consolidating released roughly £240,000 a year.
Nobody in that story did anything wrong. They used the data they had. The data was measuring the wrong thing.
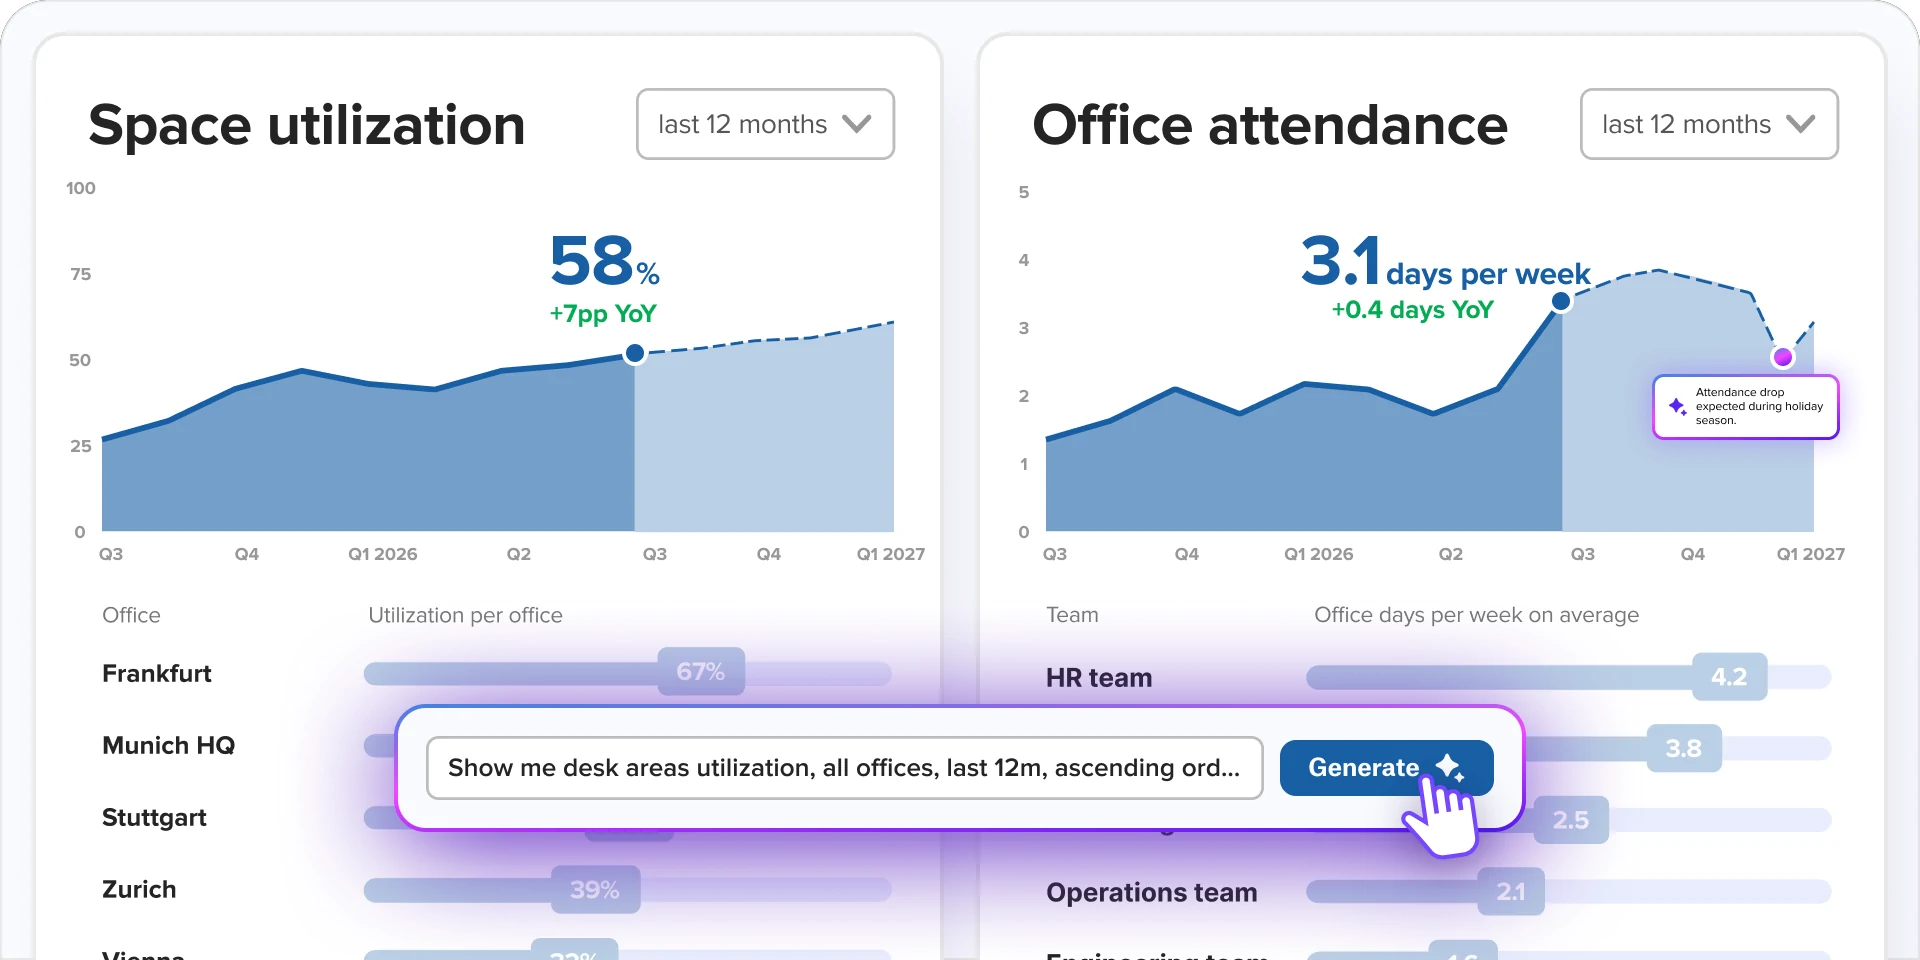
That is the gap deskbird Intelligence was built to close. It reads real presence from the network and monitors a company already owns, so occupancy reporting reflects what happened on the floor rather than what the booking system assumed. No sensors to buy, and nothing for employees to do differently.
TL;DR
deskbird Intelligence measures real office occupancy through deskbird Dock, a lightweight desktop app that detects network connections and monitor signals. No hardware installation, no employee action, no sensors to maintain.
- Booking logs measure intent, badges measure entry, and neither measures use
- deskbird Intelligence measures real occupancy at €0 in hardware, against €80 to €400 per desk for sensors
- deskbird's agentic layer turns that data into costed recommendations, inside Copilot, Claude, ChatGPT or Gemini
Almost everyone is planning on data they do not trust
The uncomfortable part is how normal this is.
JLL's 2026 Global Occupancy Planning Benchmark found that 90% of organizations now apply utilization data to space planning decisions, up from 70% a year earlier. Only 7% rate their data capability as excellent.
So the numbers get used anyway. Occupancy planning goes ahead. Leases get signed, floors get closed, desks get added, and everyone in the room quietly knows the inputs are shaky. When the decision goes wrong, it lands on the person who brought the report.
Offices are filling up, and averages hide it
CBRE puts global average office utilization at 53% in 2025, up from 38% the year before. The empty-office story is out of date.
But the same research puts peak utilization at 80%. That spread is the real trap. Averages say you have space to give back. Peaks say Tuesday is already close to full. Right-size against the average and you break the days people actually come in.
Utilization there means people genuinely using the space, not badge-ins at the door. Which brings us to how most companies measure it.
Every method gets it wrong in a different direction
Your desk booking system shows you reservations, which tells you what employees intended to do, not what they actually did.
Booking logs record what people planned to do. Someone reserves a desk on Monday, then works from home. The desk reads as occupied all day. This is intent, captured before the day happens, and it runs high.
Badge swipes confirm someone entered the building. That is real behavior, so it beats a reservation. But entry is not use. Someone who badges in and spends the day in meeting rooms looks identical to someone at their desk for 8 hours. This is how a building reads 26 points higher than it is.
Physical sensors measure presence at the desk accurately. That accuracy is exactly what exposed the gap in the CBRE study. The problem is the cost of getting there: €80 to €400 per desk depending on vendor, before installation, calibration, and battery replacement. They are also difficult to adjust once fitted, so the layout you measure is the layout you committed to.
[Table1]
The business case for workplace intelligence
Booked is not used, and the gap between the two is where the money sits. Once it is visible, 3 decisions change.
You can right-size with evidence. Floor by floor utilization shows which parts of the estate earn their footprint and which are being paid for out of habit. In the CBRE example, that was 2 floors and £240,000 a year on one building.
You can set hybrid policy on patterns rather than assumption. Peak days, weekly rhythms, and team overlap come from what people did, not what they told a booking system they would do.
You can defend the decision upward. The hardest part of a space decision is rarely making it. It is standing behind it when Finance asks where the number came from. Workplace analytics built on real presence gives you an answer that holds.
None of this requires a hardware budget, which is the part that usually stalls these projects before they start.
From occupancy data to the decision
deskbird Intelligence does not stop at reporting the gap. Its agentic layer reads the patterns across your sites and turns them into recommendations, with the saving behind each one quantified. It models scenarios, benchmarks your offices against comparable companies, and surfaces patterns nobody had the hours to go looking for.
It works inside the assistants your teams already use, including Microsoft Copilot, Claude, ChatGPT and Gemini, so there is nothing new to roll out.
You still make every call, with the occupancy data visible behind every suggestion, which is what makes a recommendation usable in front of Finance rather than something you have to take on faith.
How deskbird Intelligence measures it
deskbird Dock, the desktop app behind deskbird Intelligence, reads signals your office already produces. A device joining the corporate network is a presence signal. A device connecting to a mapped monitor or docking station is presence at a specific desk.
IT pushes it through existing device management, the same way as any other managed application. There is nothing to install at the desk and no batteries to replace, so the hardware line stays at €0.
The data is anonymized and aggregate by design, because this measures spaces and patterns, not people.
Book a demo and we will show you the gap between what your teams book and where they actually work.

Frequently Asked Questions
Does deskbird Dock require any hardware installation to track desk occupancy?
Can deskbird measure occupancy without employees booking desks first?
What happens in spaces where employees do not connect to monitors?
How does deskbird handle works council approval for occupancy tracking?
What is the difference between occupancy rate and utilization rate in deskbird analytics?
