
12 office utilization metrics for better hybrid workplaces
83% of corporate real estate teams now track space utilization metrics, yet many still make expensive decisions based on incomplete data or gut feeling. This guide explains which office utilization metrics actually matter for hybrid workplaces. Learn how to calculate them accurately. Discover what actions to take once you understand how your workspace is really being used.
TL;DR
Office utilization metrics measure how your workspace is actually used compared to its capacity. They replace assumptions with facts. With the right data, you can right-size your office and cut costs. You can also improve the in-office experience.
- The 12 metrics below cover everything from basic occupancy to forecasting accuracy. Each includes a clear definition and calculation method.
- Booking-to-show and no-show rates expose ghost bookings that skew your data and waste resources.
- Tracking the right metrics helps you justify real estate decisions and reduce unused space. It also creates a better in-office experience.
What are office utilization metrics?
Office utilization metrics measure how your physical workspace is used compared to its capacity. They track the usage of desks, meeting rooms, floors, and common areas. This happens over specific time periods.
These metrics answer a simple question: are people actually using the space you are paying for?
In traditional offices, companies assumed every employee needed a dedicated desk. Hybrid work changed this. Attendance is no longer predictable. Static headcounts do not reflect reality. Space utilization metrics give you the data to manage flexible attendance and control real estate costs. Now 83% of CRE teams track them.
Office utilization vs. office occupancy: what's the difference?
Many workplace leaders confuse these 2 terms. They measure different things.
Occupancy is a snapshot: it tells you how many people are in a space right now. Utilization looks at usage over time. It measures how long a space is used relative to the hours it is available.
[Table1]
You need both. Occupancy helps you understand peak demand. Utilization helps you understand whether spaces are earning their keep over time.
How to calculate office utilization rate
The space utilization calculation compares time used against time available. This formula works for individual desks, meeting rooms, or entire floors.
Space utilization rate = (Actual usage time ÷ Available time) × 100
Here is how to break down each part:
- Actual usage time: The hours or days a space was actively occupied or booked.
- Available time: The total operating hours or days the space was available for use.
- Time period: You can calculate this daily, weekly, or monthly depending on your planning cycle.
Consider a meeting room open for 8 hours that is occupied for 4 hours. The utilization rate is 50%. Different tools may calculate "usage" slightly differently. Consistency matters more than the exact formula. Pick one method and stick with it so you can compare results over time.
12 office utilization metrics every workplace leader should track
Not every metric matters equally. The best facility management KPIs are the ones that drive action. These 12 office space planning metrics provide the most value for hybrid teams.
1. Space utilization rate
This metric shows the percentage of your total available space that is actively used over a specific time period. It serves as your baseline for understanding office efficiency.
A low space utilization rate suggests you are paying for empty space. You need office space optimization. A rate near 100% indicates overcrowding. Use this metric to identify underused floors or zones. One floor may show 20% utilization while another is at 80%. Consolidate teams to save on energy and cleaning costs through office optimization.
2. Occupancy rate
Occupancy rate measures the number of people present divided by total capacity. It captures a specific point in time. Think of it as a snapshot of how busy the office is right now.
This metric is essential for operational planning. Facilities teams use it to know how much food to order for the cafeteria. They also use it to schedule cleaning services based on actual foot traffic.
3. Peak occupancy
Peak occupancy identifies the highest level of attendance during a given period. Average occupancy often hides the reality of hybrid schedules. An office can be 30% full on average but reach 90% capacity on Wednesdays.
You must plan your space for peak days, not average days. Reduce space based only on averages and you will run out of desks on busy days. This metric highlights the "Tuesday-to-Thursday" anchor days common in hybrid work.
4. Density per seat
This metric measures the amount of square footage allocated to each workstation. It directly impacts employee comfort and collaboration.
Hybrid offices often aim for lower density. Fewer people come in daily, so companies can afford to give employees more space. Tracking density per seat ensures you comply with safety standards. It also provides an environment that supports focused work.
5. Vacancy rate
Vacancy rate is the percentage of available desks or rooms that remain unbooked or unused during working hours. A high vacancy rate signals unused office space or poor space design.
Tracking vacancy helps you justify real estate decisions. If 40% of desks are vacant every day for 6 months, you have data to support action. Consider office space downsizing or renegotiating your lease.
6. Cost per seat
Calculate this by dividing total workplace costs (rent, utilities, services) by the number of workstations. This metric connects your space data to financial outcomes.
When you improve utilization, your cost per seat often drops. You are serving more people with the same resources. This makes it a powerful metric. It demonstrates the financial benefits of a well-managed hybrid work policy.
7. Booking-to-show rate
Booking-to-show rate measures the percentage of bookings where someone actually checked in. A low rate indicates a culture of hoarding space. Employees reserve desks or rooms "just in case" but never use them.
This metric is critical for check-in compliance. Tools like deskbird's Desk Booking feature track these rates automatically. They encourage employees to confirm their arrival. Without this data, your utilization numbers reflect intentions, not reality.
8. No-show rate
No-show rate is the percentage of bookings where no one appeared. High no-show rates suggest you need stricter policies or better tools. These ghost bookings waste resources and frustrate colleagues who cannot find a place to work.
Auto-release features help address this problem. They automatically free up a room or desk if no check-in occurs within a set time. 15 minutes is common. deskbird's Room Booking includes this capability, ensuring your utilization data reflects actual usage.
9. Meeting room utilization
Meeting room utilization measures how effectively your conference rooms are used. It considers their capacity and availability. This goes beyond simple booking data. It examines whether rooms are appropriately sized for the meetings held in them.
Track both time utilization, meaning hours booked vs. hours available, and capacity utilization, meaning attendees vs. room capacity. Your data may show large conference rooms often used by just 2 people. You have evidence to split them into smaller focus rooms. Room turnover rate measures how quickly rooms cycle between meetings. It can also reveal scheduling inefficiencies.
10. Mobility ratio
Mobility ratio measures the percentage of your workforce that works flexibly. It compares them to those with assigned seats. Calculate it by dividing the number of employees using shared workstations by your total headcount.
This metric helps you understand how hybrid your workplace actually is. A high mobility ratio means you can support more employees with fewer desks. Use flexible seating arrangements. A low ratio suggests employees still expect dedicated space, which affects your desk-to-employee planning. Track this over time to see whether your hybrid culture is maturing.
11. Average peak occupancy
Average peak occupancy smooths out single-day spikes. It averages your peak occupancy figures over a longer period, typically a month or quarter. This prevents you from overreacting to one unusually busy day.
Single-day peak occupancy matters for understanding maximum demand. Average peak occupancy gives you a more reliable baseline for space planning. Your single-day peak may hit 95% once, but your average peak is 70%. You likely do not need to add space for that rare occurrence.
12. Utilization forecast accuracy
Utilization forecast accuracy measures how well your predictions match reality. Compare your projected occupancy or utilization figures against actual results. This calculates the variance.
Tracking this metric improves your future planning and ties into broader hybrid work success metrics. If you consistently overestimate Tuesday attendance by 20%, adjust your forecasts. Update your resource allocation accordingly. Over time, accurate forecasting helps you make better decisions. These include catering, cleaning schedules, and long-term space needs.
How to collect reliable utilization data
You can gather utilization data from several sources. Each has tradeoffs.
[Table2]
Trustworthy utilization analytics require consistent data collection. They also need a strong commitment to employee privacy. Employees need to know their data is safe. deskbird's workplace analytics are built with a privacy-first approach, ensuring full GDPR compliance so you can build trust while gathering insights.
When addressing employee concerns about surveillance, focus on aggregate data. Avoid individual tracking. Be transparent about what you measure and why. The goal is making space work better, not monitoring individuals.
Weekly patterns and long-term trends
Point-in-time metrics are useful. Patterns over time tell the real story. Hybrid work has created distinct weekly rhythms that most offices face.
- Weekly patterns: Most hybrid offices see low attendance on Mondays and Fridays. Tuesdays lead at 51.5% utilization. Understanding this helps you manage resources like catering and energy use. It also helps improve attendance on quieter days.
- Seasonal trends: Utilization often drops during summer months and holidays. Tracking these trends prevents permanent space reductions based on temporary dips.
Tools for hybrid work scheduling help you visualize these trends and plan weeks or months in advance.
How to improve office utilization
Data is only useful if you act on it. Once you understand your utilization metrics, you can make practical changes. These improve how your office runs.
- Set team anchor days: Coordinate when specific teams come in. This improves workspace management and ensures the office feels vibrant rather than empty.
- Right-size your floor plan: Use your utilization data and an office space calculator to identify dead zones. Convert rows of empty desks into social hubs or meeting rooms.
- Implement desk sharing: Move from assigned seating to bookable desks. Fewer workstations can serve more people comfortably.
- Add check-in requirements: Require employees to confirm they have arrived. This simple step reduces ghost bookings and releases space for others who need it.
- Review meeting room inventory:Your data may show large conference rooms often used by just 2 people. Split them into smaller focus rooms.
For more guidance on structuring these rules, you can explore best practices for office space planning.
How deskbird helps you track office utilization metrics
Manual spreadsheets and surveys are not enough for effective office space management. Modern hybrid offices need more. deskbird automates the entire process. It gives you visibility into space usage without the administrative burden.
- Automated attendance tracking: See exactly who is coming in and when with workforce management tools. No need to ask managers to report numbers manually.
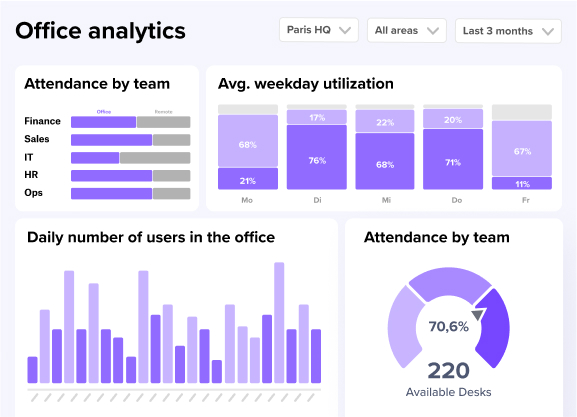
- Space utilization dashboards: Visual reports show you desk and room usage by floor, team, or time period. Spot trends instantly.
- Integration with everyday tools: Data flows directly from MS Teams, Slack, Outlook, and Google Calendar. Employees do not have to learn a new tool.
- Privacy-first design: Your data is hosted in the EU with full GDPR compliance and ISO 27001 certification.
ILF Consulting Engineers Austria faced a common challenge: rapid growth meant office space became limited while more employees worked in a hybrid model, with departments constantly debating how to allocate desks. By implementing deskbird, they transitioned to a desk-sharing model that now manages around 800 workstations across six locations. The platform provided the data they needed to maximize their existing real estate, and management no longer has to mediate space disputes.
There are no more discussions and through all the analyses, we've also realized that we actually have enough space. In fact, we could continue to grow, and desks would probably still not become scarce. But we were only able to make that statement after using deskbird to closely review desk occupancy and evaluate everything in detail.
Josef P. Mayr, Managing Director at ILF Consulting Engineers Austria
For utilization data you can actually act on, book a demo with deskbird.

Frequently Asked Questions
How do I calculate office utilization rate?
What's a good office utilization rate?
How do I reduce no-shows and ghost bookings?
What's the difference between occupancy and utilization?
How often should I measure office utilization?
Can utilization data help me right-size my office?
How do I track utilization without making employees feel surveilled?
What metrics matter most for hybrid offices?
See your office utilization data in action
- Track desk and room usage across every floor, team, and time period.
- Spot ghost bookings, peak days, and vacant zones with clear dashboards.
- Get the data you need to right-size your office and cut real estate costs.
